Understanding Inflation: What Causes Inflation and How it Impacts You
9 minutes
Inflation is a key factor affecting your investments and the future success of your financial plan. While inflation has been relatively contained for the past several decades, it has recently spiked to levels not seen since the early 1980s. What does this mean for you?
- Inflation erodes the purchasing power of the general public, but its impact goes far beyond. If left unchecked, inflation can lead the economy into a recession
- Inflation can be potentially bad for some investors, such as those holding cash or bonds
- Modest levels of inflation can also be beneficial to people holding real assets such as real estate, gold or commodities, as these assets tend to increase in value during inflationary periods
Here, we’ll define inflation and go over its causes, provide insight into its potential effect on financial assets, and compare historical periods of inflation in the United States.
Inflation Defined
Inflation is simply the ongoing increase in prices for all goods and services produced and consumed in the economy. Said another way, inflation is the decline of the dollar’s purchasing power. In the U.S., the monthly and annual inflation rate is tracked and reported in the Consumer Price Index (CPI). CPI is calculated using a basket of goods and services that’s adjusted for many factors, including geography and weather events.
CPI reflects the broad spending patterns of American consumers (“headline inflation”), not the specific things you buy. Inflation affects households very differently depending on where and how people live. A retired couple living in a condo in the south likely will experience inflation very differently than a family of six living in a large home in a northern suburb.
Consider the 12-month period ending April 30, 2022, when overall CPI rose 8.3%. That number includes fuel oil, which increased 80.5%! But at other end of the pricing spectrum are examples of why your own personal inflation rate may be rising higher than core CPI:
Figure 1. CPI Change, 12 months ending April 30, 2022
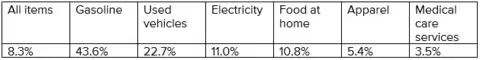
Source: U.S. Bureau of Labor Statistics
What Causes Inflation to Rise?
There are a variety of causes for inflation. Big-picture, inflation is an increase in the money supply (i.e., U.S. Treasury prints more money and puts it into circulation). Its classic definition is “more money chasing fewer goods.” The impact of these dollars flooding the economy is to bid-up the price of goods.
We’re currently in an unusual period when the other main causes of inflation—stemming from a natural disaster or economic shocks such as a pandemic or an outbreak of war—are also present:
- There are not enough products or services being produced to keep up with demand (“demand-pull inflation”)
- The cost of producing products and services is rising, forcing businesses to raise their prices (“cost-push inflation”)
- Workers are demanding higher wages to keep up with rising living costs, as well as to fill millions of open jobs (“built-in inflation” or a “wage-price spiral”)
Much of the recent inflation in the U.S. has been driven by what many economists are pegging to supply-chain issues, labor shortages and COVID-19-related production slowdowns in China. The nation is also coming off more than two years of massive government stimulus, which injected trillions of dollars into the economy to keep it running.
To put the brakes on inflation, the Fed announced on March 4 an increase of 0.50% in the interest rate that banks are allowed to charge each other. These rate increases are intended to take money out of circulation and bring inflation closer in line with the Fed’s policy target of 2.0% (it sets this target to pursue its statutory mandate of maximum employment, price stability and moderate long-term interest rates). The trick is doing that without triggering a “hard landing” or recession.
Inflation, even when it’s low, erodes savings. In the 20 years between 2001 and 2021, inflation averaged just 2.18% per year. That sounds low, but as a result of compounding, it can put a big dent in your purchasing power, as shown in the table below.
Figure 2. How Inflation Affects Your Investments
Source: http://www.usinflationcalculator.com/inflation/historical-inflation-rates/
Figure 3 below illustrates the historic power of stocks to outpace inflation. Assuming you invested and held $100,000 in stocks over 30 years at an average return of 7% after inflation (with dividends reinvested), you’d have just over $750,000.
Figure 3. Growth of $100,000 Over 30 Years

Source: Wealth Enhancement Advisory Services
Inflation Over the Past 100 years
It can be helpful to understand inflation in context, over a far longer period than just a year or a decade. To get a better sense of the impact of inflation, let’s look at it over the last 100 years.
Figure 4. Inflation Rates Over the Past 100 Years
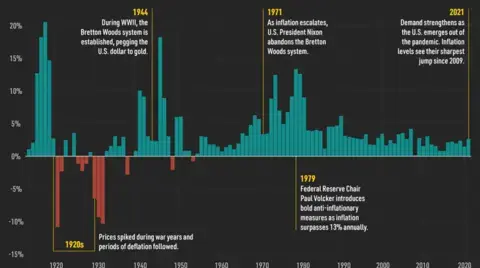
Source: New York Life Investments
As we consider the potential impacts from our current experience of inflation, Figure 4 shows us four episodes of hyperinflation in the U.S. that are worth examining more closely:
1910 to 1930
In the period leading up to World War I, the U.S. operated under the Gold Standard, with the dollar’s value pegged to gold. During World War I, the U.S. went off the Gold Standard so we could print money and finance the war. When this happened, it triggered inflationary episodes, with prices spiking upwards of 20% in 1918. After the war, when the U.S. returned to a modified Gold Standard, deflationary periods followed, helping prices moderate.
The Great Depression to 1944
The Great Depression of the 1930s coincided with similar deflationary pressures on prices. By 1933, the U.S., challenged to boost the economy, abandoned the Gold Standard once again. However, following the Bretton Woods Agreement in 1944, global exchange currency values were pegged to the dollar, while the dollar was pegged to gold. This move helped bring down the concurrent post-World War II hyperinflation and led to the booming economy of the 1950s and 1960s, a period that also saw gradually rising inflation.
1970s
In 1971, President Nixon, concerned about the ability for gold to cover the supply of U.S. dollars in circulation, imposed a freeze on wages and prices and surcharges on imports. He also abandoned the Bretton Woods Agreement for a floating exchange regime. Under a floating regime, rates fluctuate based on supply and demand relative to other currencies. Oil shocks in 1973 and 1974 led inflation to increase beyond 12%, a level of “suppressed inflation” that generally persisted through 1979.
Volcker Era
In 1979, Federal Reserve Chair Paul Volcker introduced an aggressive program to combat inflation. Instead of managing inflation through interest rates, which the Fed had done previously, Volcker would attempt to crush inflation through tight monetary policy. By limiting the number of dollars in circulation, interest rates would increase, and prices would moderate. While interest rates jumped to 20% in 1980, leading the country into a brief recession, by 1983, inflation dropped below 4%. Four decades of generally low, single-digit-inflation would follow.
Is Inflation Different This Time?
Compared to the Volcker era, today’s uptick in inflation (to 8.5% at the end of March 2022) is very different. In 1982, the Fed was focused on adjusting the money supply, causing interest rates to fluctuate with little warning.
Today, the Fed, in seeking to manage inflation to a long-term “anchor” rate of 2.0%, mostly ignores the money supply and instead uses its authority to set interest rates to tame inflation. In early May 2022, it increased its main policy target range for the federal funds rate to between 0.50% and 1.00%.
According to an analysis earlier this year by Greg Ip in The Wall Street Journal, the key challenge facing current Fed Chairman Jerome Powell is deciding whether today’s inflation “has more in common with 1946 or 1966.” He appears to see a bit of both.
In 1946, prices surged after the end of World War II, and inflation jumped to over 20% as a result of the elimination of price controls, supply shortages and pent-up demand—a situation very similar to what the U.S. has experienced over the past two years. But, also like today, the 1960s rise in inflation came on the heels of a long period of low, stable inflation and low unemployment.
What’s different this time is that the Fed has 100 years of past experience and data upon which to make its policy decisions. Still, given all the economic uncertainties engulfing the globe—from supply-chain disruptions, a continuing COVID-19 lockdown in China, and political unrest from the Ukraine-Russia conflict and a divided electorate in the U.S.—it is far from settled that the Fed will be able to easily engineer a soft landing this cycle.
Interest Rates and Stocks
What effect might the Fed’s raising interest rates have on the stock market? When interest rates rise, investors are paid more to own bonds, which are typically less risky than holding stocks. Over the past 20-year history of rate-climbing cycles, only in one instance was the stock market lower one year later (as measured by the S&P 500). As you can see in Figure 5 below, after the Fed raised rates, the market was up roughly 10%, on average, a year later.
Figure 5. S&P 500 Performance One Year After the Fed Raised Rates, Since 1994
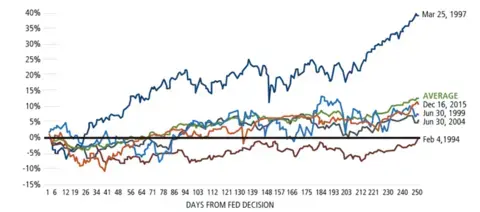
Sources: Yahoo Finance, Calamos.
While past performance does not guarantee future results, our internal forecasts currently do not suggest that we are heading into recession for the remainder of 2022. But as the world digests high debt levels, inflation pressures, elevated valuations, and less dovish central banks, we anticipate increased bouts of volatility in stock and bond markets.
Modest inflation by itself is not necessarily a bad thing, and higher interest rates could present attractive opportunities for long-term investors to acquire bonds at materially higher yields than we’ve seen in many years. While the Fed’s recent rate hike was long-expected, and future hikes likely to be gradual, no one can predict the reaction of the market. That’s why we advise investors have long-term financial plans that earmark certain funds for the short term, midterm and long term. That way, the money you need in the short term can be placed in asset classes that aren’t as exposed to near-term market risks.
Insights
Related resources for you
Get the latest wealth management tips and trends from our library of articles and resources.


