November 2023 Market Commentary
6 minutes

Editor’s Note: This commentary was written with input from Matthew D. Parks and covers the period from October 1 to October 31, 2023.
Executive Summary
U.S. equities continued their selloff in October, as Technology stocks underperformed the broader U.S. market, falling -10.5% from their previous highs from earlier in the year. Volatility has once again surged, however, early returns in November appear strong.
What Piqued Our Interest
Any door left open too long will remind you winter has come yet again. While the seasons & holiday traditions change little year-to-year, they do follow a repeating pattern. Financial markets can be strikingly similar.
The market decline in 2022 happened in nearly half the time and was nearly half as severe as the 2008 Great Recession. So far, the 2023 recovery has again happened in nearly half the time and has seen nearly half the gain as 2009.
Figure 1. 2008 Recession & 2009 Recovery vs. 2022 Bear Market & 2023 Recovery
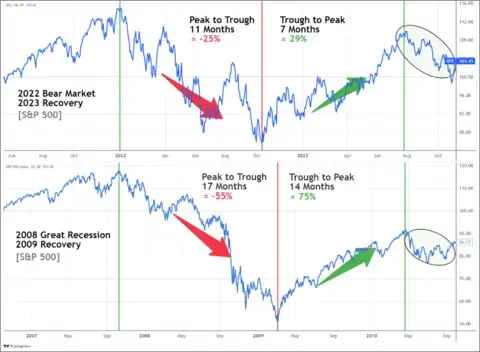
Source: TradingView
The recent market selloff and increased volatility in the last few months follows the historical archetype of a market recovery. While the economic and market factors change and no model is perfect, an examination of historically similar markets provides possible context for recent volatility.
History never repeats itself. We can, however, look for similarities. In 2010, the market recovery experienced signs of jitters. The market sold off while volatility jumped. We are seeing a similar pattern this year. The VIX (which is an index that measures volatility based on S&P 500 index options) is half what it was in 2010—in line with the scale and pace of the 2022 bear market relative to the 2008 Great Recession.
Volatility jumped markedly relative to earlier this year. Compared to a longer timeframe, market volatility is still below average. Historical data suggests that market volatility trends down throughout a recovery. If the market has indeed entered a recovery, history would say the recent volatility is likely to subside over time.
Figure 2. Relationship Between S&P 500 and VIX During 2009 Recovery & 2023 Recovery
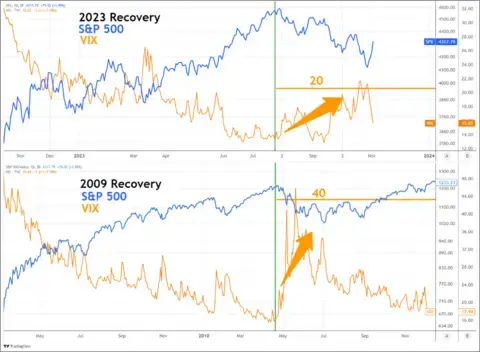
Source: TradingView
Interest rates continued their “mid-year melt-up.” There are signs that a recession in the near term is less likely than originally predicted. In turn, rising interest rates on longer maturities indicates the market is starting to believe the Feds “higher for longer” rhetoric. The recent pullback and volatility is potentially linked to interest rates surging to highs not seen since 2007. Uncertainty negatively impacts the valuation of nearly all asset classes. There is building uncertainty about how long rates will remain elevated and the impact higher interest rates will have on the economy in the coming years.
Slowing economic growth globally suggests interest rates have limited upside, which is good news for bonds. The question becomes how long interest rates will remain elevated. The average U.S. annual real GDP growth rate over the last four quarters is 1.9%. The same measure of real GDP growth for the European Union stands at just 1.5%. A hard landing appears to have been avoided with sustained positive economic growth. Given softening economic data, a shift toward easing monetary policy seems likely in the not-too-distant future.
Figure 3. 10-Year U.S. Treasury Yield Since October 2021
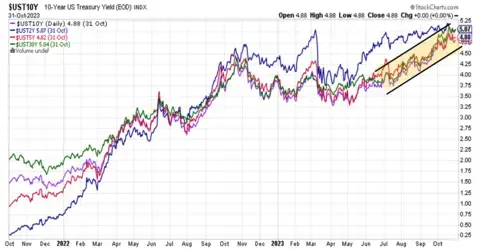
Source: StockCharts
Market Recap
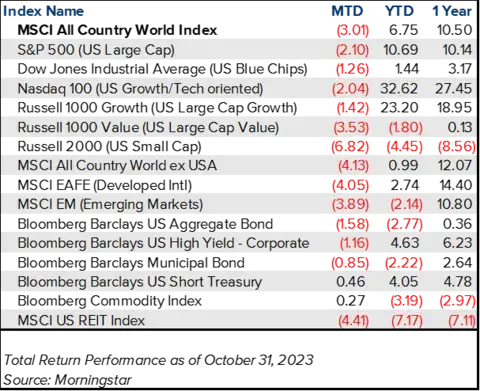
As the selloff from 2023 highs continues, select areas of global equity markets entered negative territory for the year. Broader U.S. equity markets remain positive, supported by the strength in Tech stocks. The widening divide within different segments of the market is to be expected following a bear market. Meanwhile, the hardest hit segments of the market in 2022 are 2023’s top performers.
Small Cap stocks, bonds, and REITs are suffering from higher-for-longer interest rates. Small Cap stocks have trailed the broader market for three consecutive months, ending the month down -4.45% YTD. With bonds (as measured by the Bloomberg Barclays Aggregate Index) looking at a possible third calendar year of losses, 2023 is poised to be another tough year for the typical 60/40 stock/bond portfolio. According to NYU’s Stern School of Business, 2022 was the worst year for the typical 60/40 portfolio since the 1930s.
Interest rates are the driving factor used in determining the discounted cash flow valuation for income-generating assets. Typically, REITs offer diversification of risk relative to stocks. Interest rate fluctuations over the past 3 years has resulted in an above average correlation between REITs and equities.
Demand for rate-sensitive assets has gradually weakened as high interest rates are sustained longer than originally anticipated. The potentially limited upside on interest rates means income-generating assets like bonds, REITs, and dividend stocks may present an attractive valuation opportunity relative to the broader equity market.
Closing Thoughts
Rising interest rates on the long end of the curve and gradually weakening global economic growth have taken center stage. With the fire hose of stimulus falling further in the past, it appears the likelihood of inflation resurging is shrinking. Despite slowing economic data, the market continues to show signs it believes a soft landing is now more likely than not.
The recent uptick in volatility is in line with the anatomy of a market recovery based on similar historical examples. Since the start of 2021, the S&P 500 is up 11.7%. Regardless of whether or not we experience an economic downturn next year, the future appears bright in the long run.

Insights
Related resources for you
Get the latest wealth management tips and trends from our library of articles and resources.