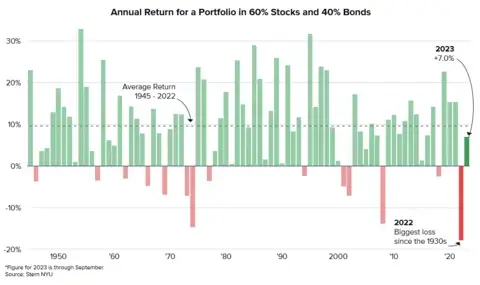
For decades, investors have been told that investing in a portfolio of 60% stocks and 40% bonds is a tried-and-true method to diversify and optimize returns. This strategy assumes that most of the returns will come from your equity exposure while fixed income will provide the needed ballast to offset losses in down years for the market. Modern portfolio theory supports this methodology, and since 1945, it has yielded an average return of close to 10%.
Unfortunately, for the last year and a half, investors have not been rewarded for employing this approach.
Last year was the worst year for the 60/40 portfolio since the Great Depression, and through October, this year is also turning out to be challenging, with bonds once again staring down losses for the year.
Figure 1. Performance of Stocks and Bonds Since 2022

Past performance is not a guarantee of future results. For illustrative purposes only. Investments cannot be made directly in an index.
Figure 2. Average Annual Return for a 60/40 Portfolio Since 1945

To put this into perspective…
- Since 1976, the Bloomberg U.S. Aggregate Bond Index had never declined in back-to-back years before 2021-2022.
- The average total return (coupon plus price change) for a 10-year U.S. Treasury bond has been 4.87% from 1928 through 2022. Only once has the total return been negative in back-to-back years prior to 2021-present (1955-1956, -1.34% and -2.26% respectively).
- The 10-year U.S. Treasury lost -4.42% in 2021 and -17.83% in 2022. Through the end of October 2023, the 10-year index is down around -5% as rates continue to climb, further extending this unprecedented losing streak for bonds.
So, what changed with the 60/40 portfolio? Historically, when stocks sold off, bonds appreciated, benefiting from a risk-off, flight-to-quality trade. But the historic rise in interest rates over the last 18 months has challenged this dynamic. Bonds’ tendency to rise when stocks fall generally happens when inflation and interest rates are low or declining, which hasn’t been the case.
Outside of a handful of U.S. Mega Cap Technology stocks, this year has been challenging for most equities. While the S&P 500 is still up around 9% YTD through the end of October, the equally weighted version of the index is down -4.74%.
Figure 3. S&P 500 Performance YTD 2023

Investors hedging with a globally diversified portfolio also faced headwinds. The MSCI EAFE Index, which tracks international developed markets, was up just over 3% through October, largely in part due to the strength of the U.S. dollar. The MSCI Emerging Market index is negative YTD, down -1%. through October.
Despite Challenges, There Are Reasons for Optimism
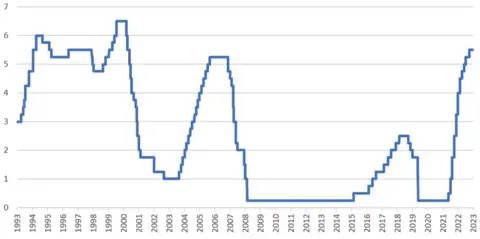
After 18 months of increases, the Fed may finally be nearing the end of this rate-hiking cycle. There could be another small hike this year or next, but we believe 75-basis-point hikes like we saw last year are out of the question. This should limit how much further rates could go on the long end and stem the losses experienced by bondholders.
Figure 4. Fed Funds Rate – Fastest Incline in 30+ Years

Source: FactSet
Rates on the long end of the curve are more attractive than they’ve been in 16 years. Rates could go higher still, but the income received will reward patient investors who hold onto their bonds. If we do enter a recession next year, rates could move significantly lower from today’s levels, and investors would quickly make up unrealized losses. Given how far bonds have dropped, this could be an attractive entry point while locking in higher-than-average yields.
On the equity side, it’s worth noting that even after a 10% pullback off of July highs, the S&P 500 is still up roughly 10.5% through October, all while absorbing:
- 11 rate hikes from the Fed over the past 20 months, bringing the Fed Funds Rate to 5.5%, the highest level since the dot-com bubble in 2000
- War overseas, including the Russia-Ukraine War and the recent conflict between Israel and Hamas in Palestine
- A 40-year secular reversal in 10-year bond yields and a 51% rise in 10-year bond yields in just seven months
- A 16-months-and-counting inversion of the U.S. Yield Curve
- Disarray in Washington D.C., with a vacated Speaker of the House position (filled by Mike Johnson, October 25, 2023)
- Significant macro challenges, including rising oil prices, a strong U.S. dollar, and higher interest rates
- A regional banking crisis in March 2023 that led to a near collapse of the U.S. banking system
- Slowing economic data
As it relates to the end of this rate-hiking cycle: Since 1989, the average S&P 500 return between the last hike and the first cut has been 12.93%.
On average, the first cut occurred 8.2 months after the last rate hike. Six months after the first cut, the S&P 500 was higher 67% of the time, with an average return of 6.57%.
While macroeconomic challenges have exerted downward pressure on stocks in recent months, the S&P 500’s upward trend off the lows in October 2022 remains intact. Historical seasonal Q4 trends—coupled with extreme oversold levels—may help support a constructive view on equities through Q4.
From a seasonality perspective, since 1928, among the 39 negative Q3s, only 11 of them were followed by a negative Q4. A negative Q3 and Q4 happened only 12% of the time since 1928 (the last two occurring during the dot-com bubble in 2000 and during the Global Financial Crisis in 2008). Following negative Q3s, the S&P 500 averaged 2.4% returns in the fourth quarter, with a median of 4.6% and a 71% positivity rate.
Strategies to Consider for Q4 and Beyond
It is always important to rebalance your portfolio when the portfolio drifts from its intended strategic asset allocation. Over the long term, strategic asset allocation will be the most important driver of performance and the greatest contributor of risk, so getting it right is critical. Near the end of the business cycle, and with volatility on the rise (like where we find ourselves today), now is a perfect time to ensure that your objectives and portfolio are aligned.
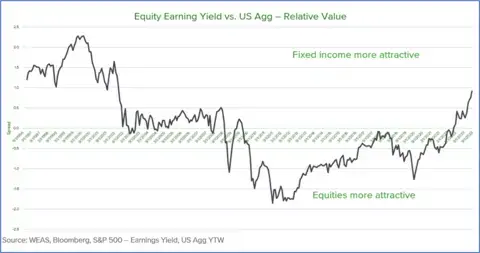
Even though fixed income has performed poorly over the past three years, on a historical basis, bonds haven’t been this attractive relative to equities in over 20 years. The yield on the Bloomberg U.S. Aggregate Bond Index is now 1% higher than the earnings yield of the S&P 500 (inverse of Price to Earnings). This doesn’t mean that investors should go “all-in” on bonds, but it does suggest that from a valuation standpoint, fixed income is much more attractive (and over the long term, valuations matter).
Figure 5. Equity Earning Yield vs. U.S. Aggregate – Relative Value

Given that both equities and fixed income have exhibited higher correlations than usual, as both have been negatively impacted by higher rates, it is worthwhile to take another look at alternative investment strategies. Alternatives come in many shapes and sizes, including both private (illiquid) and public (non-traditional mutual funds), so all investors have access to strategies that are non-correlated to stocks and bonds.
Instead of 60/40, why not consider a 50/30/20 portfolio with 20% representing alternatives? Investors can achieve similar returns over the long term with lower projected risk due to lower correlations with traditional asset classes. The 20% alternative sleeve can incorporate exposures to a variety of asset classes within the alternative space, including private equity, alternative credit, real assets, and hedge funds. This asset class is more accessible than ever, with minimums as low as $2,500. Clients with greater amounts of wealth can access limited partnership vehicles that offer greater exclusivity, albeit with less liquidity.
Another idea is to embrace hedged equity strategies. Hedged equity includes funds that use options to hedge against equity risk while providing market exposure on the upside, typically to a predetermined cap. The category also includes structured notes, which are linked to underlying equities and can be customized to create limitless opportunities. Using these strategies can help investors stay invested while protecting against a potential downturn (without having to guess when it might occur).
Don’t Overlook These Timeless Strategies
Many equities and fixed income securities are negative on the year. A great way to enhance after-tax returns is to employ tax-loss harvesting, which entails selling individual securities or funds that are at a loss and replacing them with similar (but not identical) securities. Investors can harvest these losses and use them to offset future gains while preserving the integrity of the investment portfolio. The key is to select replacement securities that can be held as model holdings going forward, which eliminates the possibility of selling the replacement and realizing short-term capital gains.
Another strategy to minimize taxes is to pay attention to year-end capital gains distributions and replace those funds that are planning on making large taxable distributions. Mutual funds are prone to making large payouts, which become taxable events (sometimes at short-term rates), even in years where the fund has a negative return on the year. The decision to sell depends upon the cost basis of the holding, but in certain cases where the fund is flat or negative, the decision to replace the fund can help reduce investor’s tax bill.
Finally, embrace a simple dollar-cost averaging technique when putting new money to work. Make sure that idle cash is parked in a vehicle that is yielding at least 4-5%, and systematically invest pro-rata across 3-4 equal time periods. Timing which asset class to invest in is a nearly impossible task. Some will get it right some of the time (and will never admit when they got it wrong), so we advise clients to create a plan and stick with it. Over the long run, simply being invested is more important than trying to time peaks and troughs in the market.
There is no guarantee that asset allocation or diversification will enhance overall returns, outperform a non-diversified portfolio, ensure a profit or protect against a loss. There can be no assurance that any particular investment objective will be realized or any investment strategy seeking to achieve such objective will be successful. Investing involves risk, including the possible loss of principal.


