March 2024 Market Commentary
7 minutes

For the period February 1 – February 29, 2024.
Executive Summary
The S&P 500 continues to notch new record highs in 2024, fueled by strength in the Technology sector and expectations for more accommodative monetary policy. While the Fed may not be in a rush to lower interest rates, the combination of solid earnings and a resilient labor market supports the case for further strengthening of the economy and risky assets.
What Piqued Our Interest
There has been a lot of debate about whether we are experiencing a bubble similar to the late ’90s dot-com era or any one of history’s notorious asset bubbles. Concentration of the largest stocks is rivaling all-time highs of past stock bubbles. The combined weight of the top 10 stocks in the S&P 500 is now roughly one-third of the overall index, significantly higher than what it was in the late 1990s. This is nothing new, as the “Magnificent 7” stocks—Apple, Microsoft, Amazon, Nvidia, Tesla, Meta, and Alphabet (Google’s parent company)—have been driving equities higher for the past several years, with only the bear market of 2022 slowing down this longstanding trend of higher concentration in the U.S. equity market.
Wondering what this could mean for your portfolio? Click here to meet with one of our advisors.
Should investors be concerned? Perhaps they should take notice, but the underlying fundamentals of the largest stocks in the index have drastically different metrics than their counterparts did in the late ‘90s. Today’s leaders are highly profitable, established market leaders with substantial free cash flow, which all leads to higher earnings and much more reasonable valuations on a historical basis. Case in point, the cap-weighted average forward price-to-earnings ratio of the top 10 stocks at the end of February was around 30.7. This is undoubtedly on the high end but not nearly as egregious as one might expect.
Combined Market Weight of Top 10 Stocks in the S&P 500
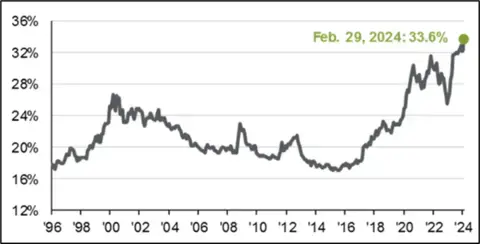
Source: FactSet, Standard & Poor’s, J.P. Morgan Asset Management.
Rather than being concerned about the longevity of the U.S. Mega Cap rally, investors should instead understand why this is occurring and what might need to change for the trend to reverse. One of the obvious tailwinds for the Mag-7 is the emergence of artificial intelligence and its far-reaching implications across all sectors. It seems likely that we’ve only experienced the “tip of the iceberg” as it pertains to the growth potential of AI, which bodes well for companies like Nvidia, Microsoft, and others who are developing AI technology or stand to directly benefit from it. Other factors, such as the evolution of subscription-based business models and the resilience of U.S. consumers, are also contributing to the success of the Mag-7.
Another driving factor for the current lack of breadth in the market is related to the volatile interest rate environment we’ve experienced over the past two years. The correlation between interest rates and the S&P 500 has reached -60%, which is the most inverse level in over 25 years. In other words, the market is being predominantly driven by macroeconomic factors—interest rates and inflation, in particular. Not only that but as rates have moved higher, market breadth has also declined with a high degree of correlation, while lower rates have contributed to stronger market breadth. This is because smaller companies are more sensitive to interest rates, and investors justify higher valuations for riskier stocks in a low interest-rate environment. This doesn’t imply that we are anticipating a collapse of the tech bubble but rather that lower rates should support multiple expansions for a broader universe of stocks, especially as we expect rates to decline later this year.
Market Recap
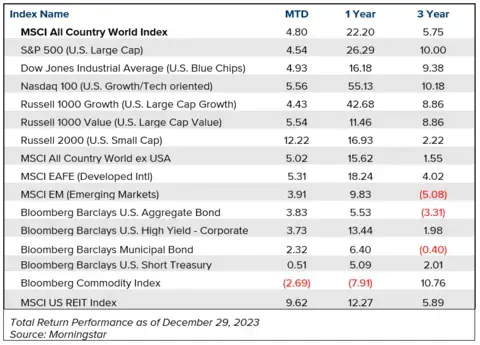
Equity markets, both domestic and international, were strong in February, as the MSCI All Country World Index gained 4.29% on a total return basis. The U.S. Large Cap Growth segment led the way once again, as sectors such as Consumer Discretionary (+8.71%) and Industrials (+7.23%) benefited from the improving economic landscape and expectations of a soft landing. Utilities were the lagging sector, gaining just 1.12% after declining -3% in January. Of note, the U.S. Utility sector, which is critical for supporting the growth of AI, electric vehicles, data centers, and much more, now accounts for just 2.2% of the S&P 500 market cap, its lowest level since 1999. After a rough start to the year, both Small Cap and Emerging Market stocks rebounded in February. The MSCI EAFE Index, which tracks developed international stocks, gained only 1.83%, somewhat muted by a slightly stronger U.S. Dollar.
The U.S. bond index declined -1.41% last month as yields on the longer end of the curve crept modestly higher from 3.85% to 4.24%. Other fixed income sectors produced “barely positive” returns, including the U.S. Short Treasury, Corporate High Yield, and Municipal Bond indices. Commodities were once again in the red, falling -1.47% in February, largely due to continued weakness in natural gas and grain prices. After a rough start to the year, the MSCI U.S. REIT Index bounced back, gaining 1.94%, even as negative headlines around office real estate continue to garner the wrong kind of attention.
Closing Thoughts
Federal Reserve Chief Jerome Powell has made it clear that the Fed is in no rush to lower rates, which has had little overall impact on this year’s market rally. Even though the market was pricing in as many as seven rate cuts at the start of the year, those expectations have been dashed to three or four. However, the market continues to reach new highs.
The labor market continues to be extremely resilient, with the trend of low unemployment continuing strong. Meanwhile, GDP growth expectations remain at moderate levels. Along with the fact that Core PCE (the Fed’s preferred inflation indicator) ticked higher last month, all support the reason why the Fed is content to do nothing and wait for more indications that inflation is trending back to 2%.
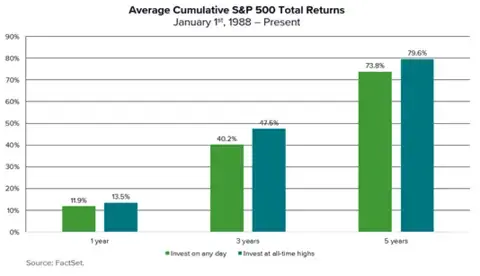
The market appears to be content as long as the Fed doesn’t indicate that rate hikes are back in the picture. Some investors tend to be cautious when the market hits new all-time highs, but history actually suggests they should be the opposite. In fact, over the past 35 years, the average one-year return following a new all-time high was 13.5%, notably higher than all times combined. The average three- and five-year returns are even higher, as the above graph demonstrates. Looking even further back to 1950, the market was higher one year following a new all-time high 71% of the time and was higher after three years 87% of the time—not bad odds for putting new money to work. The moral, of course, is that no matter what the Fed does this year, and despite the market trading at all-time highs while being historically concentrated, it pays to be invested for the long run.

Insights
Related resources for you
Get the latest wealth management tips and trends from our library of articles and resources.